
Handball Performance-Index: Data-based, transparent, fair
Data-based. Transparent. Fan-focused. For the 2020/21 season, Handball-Bundesliga GmbH is introducing a new benchmark for evaluating the performance of all LIQUI MOLY HBL players. The Handball Performance Index was designed in cooperation with Deutsche Kreditbank AG and selected experts from top-level sports and science. It uses selected statistics from all players to evaluate, analyze and compare their athletic performance at all positions.


The Handball Performance Index, which has been introduced for all LIQUI MOLY HBL players with the beginning of season 2020/21, is designed to provide a transparent and comparable performance assessment of all players. Based on various statistics, which are weighted differently depending on the position, a specific index can be attributed to each professional player.
The new HPI: The representation
The task force members Uwe Gensheimer (Rhein-Neckar Löwen), André Haber (SC DHfK Leipzig), Dr. Patrick Luig (DHB) and Co. met in the run-up to the Pixum Super Cup 2921 in Düsseldorf to work out recommendations for action to optimize the HPI in several small groups.In the sense of easier access for those interested in sports and in order to be able to compare performances of different positions even better, in the future the values will be mapped on a scale from 50 to 100 by means of a linear projection. The minimum and maximum values of HPI points of the respective position group (back, outside, circle, goal) from the previous season form the corridor in which all new values are set in relation.
Calculation based on HPI points
The neutral starting value before the start of the game is 100 HPI points for all players. Based on this, positive actions on the field (e.g. goals, assists, saves) result in plus points, negative actions (e.g. technical errors, missed throws) result in minus points.
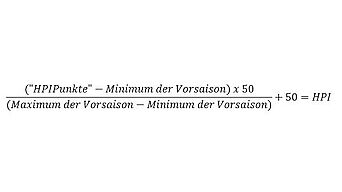
The value composed of the positive and negative actions of a player is converted from HPI points to the new HPI using the given formula.
Using a linear projection, the HPI points (below) known from the previous season are now mapped in a new scale.
HPI 2.0: This is how it works!
Goalkeeper
| Type | Probability save | Points for save | Points for goal against |
|---|---|---|---|
| 6 Meters Center | 21% | 8 | -2 |
| 6 Meters Left/Right | 26% | 7 | -3 |
| Penalty | 25% | 8 | -2 |
| 9 Meters Center | 30% | 7 | -3 |
| 9 Meters Left/Right | 35% | 7 | -3 |
| Backcourt | 7% | 9 | -1 |
| Direct free throw | 21% | 5 | -5 |
| Fastbreak | 20% | 8 | -2 |
| Wing | 36% | 6 | -4 |
| Unknown | 21% | 8 | -2 |
Note on goalkeeper saves
Throws from wing, fastbreak or penalty that hit the post, the crossbar or go next to the goal are counted as goalkeeper saves.
Court players
| Type | Probability goal | Points for goal | Poins for assist | Points for throw off |
|---|---|---|---|---|
| 6 Meters Center | 70% | 6 | 4 | -7 |
| 6 Meters Left/Right | 66% | 6 | 4 | -7 |
| Penalty | 75% | 5 | 5 | -8 |
| 9 Meters Center | 42% | 10 | 0 | -4 |
| 9 Meters Left/Right | 41% | 10 | 0 | -4 |
| Backcourt | 64% | 6 | 4 | -6 |
| Direct free throw | 8% | 10 | 0 | -1 |
| Fastbreak | 80% | 5 | 5 | -8 |
| Wing | 64% | 6 | 4 | -6 |
| Unknown | 78% | 5 | 5 | -8 |
Note on field player statistics
For a self-assisted goal for which there is no assist player, the goal scorer receives 10 points. (Self assist)
For a goal or save in the last 5 seconds of a game, the scorer/goalkeeper will receive an additional 50% points to their goal/save. Provided the goal or saves prevent or result in a point being won or lost.(Buzzerbeater)
Other events
| Type | Points |
|---|---|
| Suspension | -3 |
| Red Card | -10 |
| Penalty caused | -7 |
| Block | 7 |
| Steal | 8 |
| *Technical fault | -6 |
Note for the other events
*Missing passes with immediate consequence of a throw or goal of the opponent will be evaluated with an increased minus point number (-8 points). This scoring is only valid for the 1st HBL. In the 2nd HBL, the player will always receive -8 points for a technical fault.
Example: Calculation of HPI for the goalkeeper position
The player Till Klimpke from HSG Wetzlar is used as an example. Klimpke played in the game against THW Kiel in October 2020 in the goal of HSG. At the beginning of the match, the player's score was the standardized baseline value of 100. Immediately after the end of the match, Klimpke's Handball Performance Index was composed as follows:
- Initial value HPI = 100
- Plus points = 146
- 8x saves from 6 meters = 64
- 5x saves from 9 meters = 35
- 1x saves after penalty= 7
- 2x save from wing = 12
- 1x saves after fastbreak= 8
- 3x Assist to fastbreak = 15
- 1x Goal fastbreak = 5
- Minus points = -59
- 9x Goals from 6 Meter = -20
- 4x Goals from 9 Meter = -24
- 5x Goals from Wing = -12
- 3x Goals from fastbreak = -6
- 1x Goal after penalty= -3
This results in a value of 187 HPI points. Based on a linear projection, the Handball Performance Index for Till Klimpke after the match HSG Wetzlar vs THW Kiel is 91:
(187-43) x 50 / (219-43) + 50 = 91
(HPI points - Minimal HPI of the previous season) x 50 / (Maximal HPI of the previous season - Minimal HPI) + 50
Example: Calculation of HPI for the left back position
Exemplary is the player Michael Damgaard from SC Magdeburg. Damgaard played as left back in the match against Füchse Berlin in October 2020. At the start of the match, the player's HPI was the standardized baseline value of 100. Immediately after the end of SC Magdeburg vs. Füchse Berlin, Damgaard's Handball Performance Index was composed as follows:
- Initial value HPI = 100
- Plus points = 91
- 8x Scoring from 9 meters = 80
- 1x Assist to the position "6 meters center" = 4
- 1x Assist to the position "6 meters left" = 3
- 1x Penalty = 4
- Minus points = -23
- 1x Turnover = -8
- 2x Missed throws from 9 meters = -8
- 1x Missed throw from 6 meters = -7
This results in a value of 168 HPI points. Based on a linear projection, the Handball Performance Index for Micharel Damgaard after the match SC Magdeburg vs. Füchse Berlin is 89:
(168-44) x 50 / (205-44) + 50 = 89
(HPI points - Minimal HPI of the preseason) x 50 / (Maximal HPI of the preseason - Minimal HPI) + 50